ENERGY, FOOD, POPULATION, RESOURCES, SOVERIGN DEBT AND WORLD ECONOMIES:
Where's it all heading?
(Note: this is a Work In Progress--updated 6 December 2012)
DATA SOURCES:
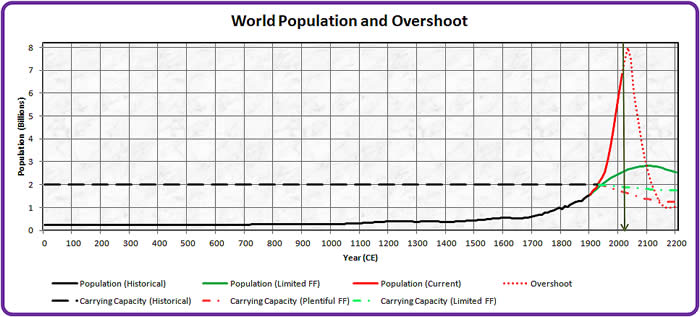
World population forecasts in 4 scenarios
http://www.paulchefurka.ca/CC_Overshoot.html
World population growth animations
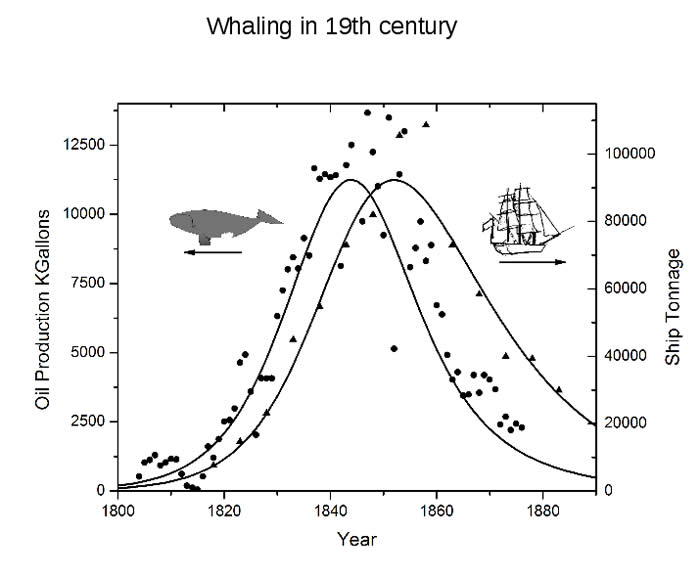
Affordable food is only possible when energy is cheap
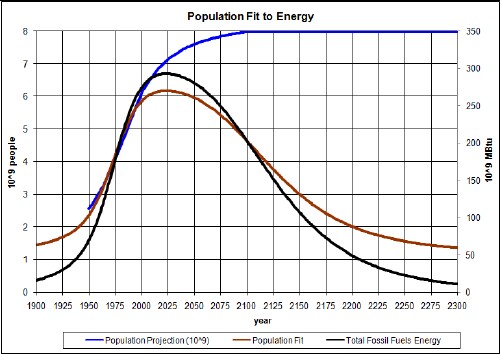
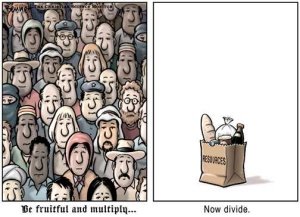
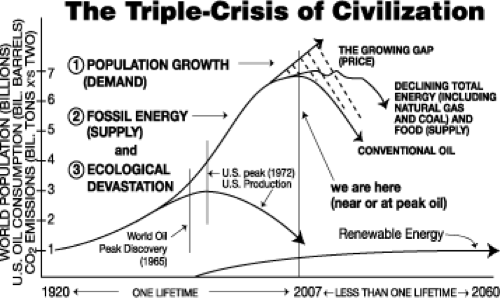
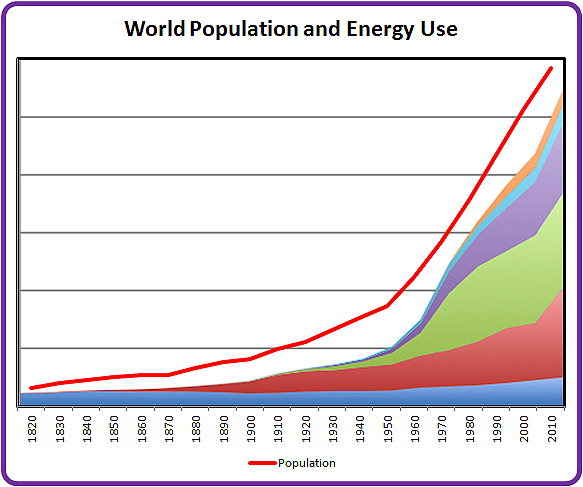
Earth's population carrying capacity is directly related to our ability to extract cheap fossil fuels that are used to produce affordable food.
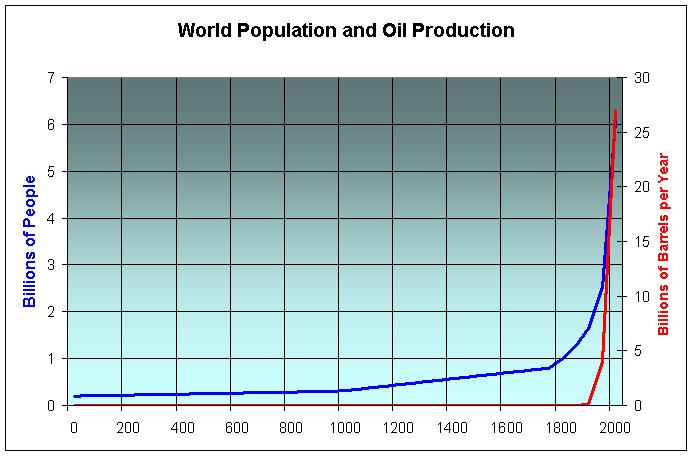
Fossil fuel energy has been used by humans for the past 100 years as a surrogate for manpower and (real) horsepower to leverage the amount of food and goods production that any single human being could have achieved on their own.
Our ability to support an increasing population has largely been a result of our ability to extract more cheap oil that is used to produce more grain to feed more people. And commercially-produced meat for human consumption requires many times more energy input than grain. (see below).We are now quickly approaching a stage where easily obtainable energy is nearly exhausted and the energy required to extract additional energy from fossil sources will soon equal or exceed the net energy value of the energy obtained. This is referred to as the Net Energy Return On Energy Investment. (NEROEI). When NEROEI becomes less than 1 it will no longer be possible continue to extract energy from the remaining fossil fuel stores, even though there may be vast quantities remaining. The issue is not simple the economic cost of energy extraction, but the ENERGY cost of extraction.
23% of all fossil fuels used globally go to the production of FOOD.
When available cheap energy declines, affordable food supplies will diminish.
At present "...we do not know where 50% of the energy we will need in 20 years is going to come from" (Per Dahlen, Singapore, 2012)
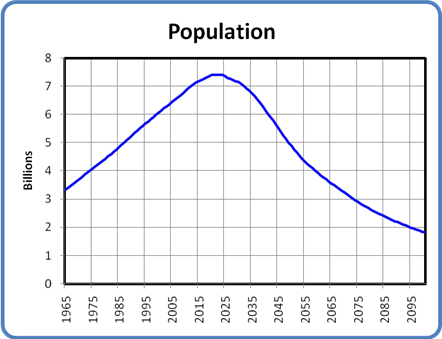
Unless new sources of cheap energy can be found or created, the population of the planet is likely to evolve as follows between now and the year 2100.
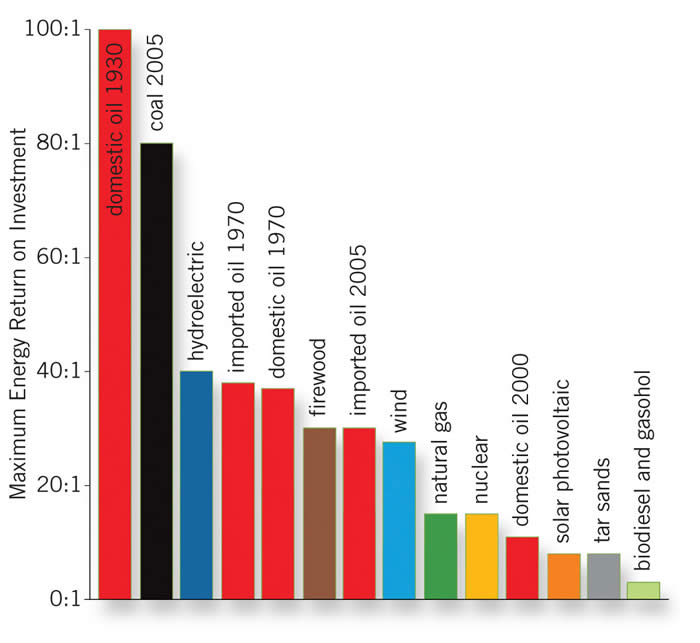
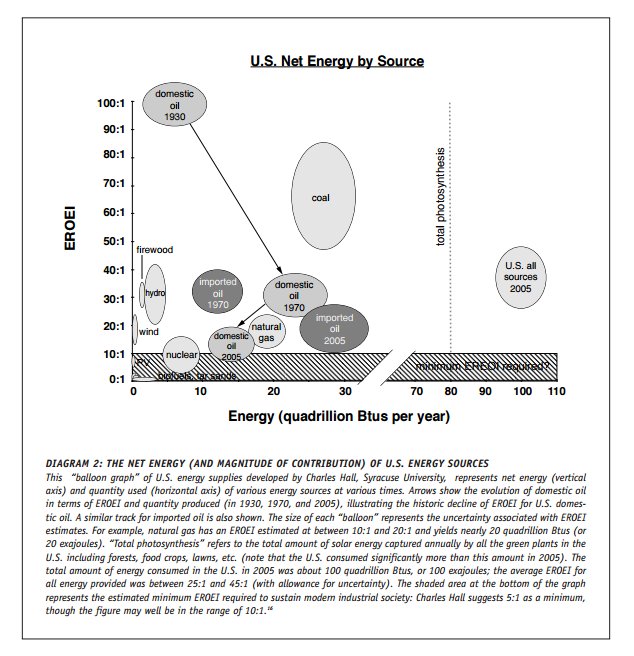
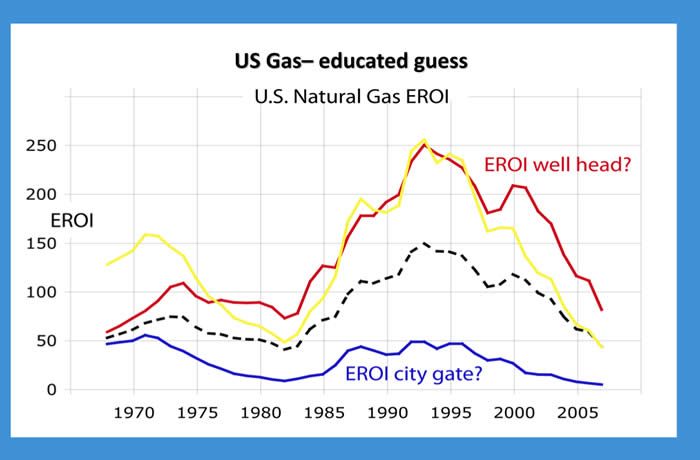
Net Energy Return On Energy Invested
WHAT IS NET ENERGY?
To harness and consume energy requires some type of energy investment. This investment is what comprises the difference between gross energy and net energy. There is various nomenclature that describes this concept. Energy profit ratio, surplus energy, energy gain, EROI, and ERoEI all represent virtually the same relationship of how much energy we receive, relative to an energy input(dollars do not factor in). The most referenced metric in the Peak Oil literature is EROI or ERoEI (Energy Returned on Energy Invested), which, in its simplest sense is the ratio:
Energy Output / Energy Input
There is disagreement (sometimes dramatic ) in the energy literature not only as to what should be included as energy inputs and outputs (a boundary issue) but how variables are included (how to evaluate co-products, how to include other limiting inputs to an energy technology, etc) These nuances will be covered in a subsequent post.
Net energy is typically given as per unit of energy invested. Thus:
EROI = Net Energy + 1.
(For those of you who've played craps - some tables pay off the hard-ways FOR one and others TO one. EROI and net energy have a similar relationship. EROI is how much energy output FOR an energy input and net energy is the energy output TO the energy input.)
Net energy also can refer to a sum as well as a ratio. For an ethanol process that has an EROI of 1.2:1 -the net energy is just .2, but we can also calculate how much net energy is created for society in a given year or a life-of-resource total. At EROI of 1.2, the 3.9 billion gallons that the US produced in 2005 required 3.29 billion gallons of BTU energy input, resulting in a `net energy' of 610 million gallons. (This post will use net energy and EROI interchangeably - if a sentence uses EROI, just subtract one to get net energy, if I use net energy, just add one to get EROI)
Source: http://www.theoildrum.com/story/2006/8/2/114144/2387
Source: http://www.ifg.org/pdf/Searching%20for%20a%20Miracle_web10nov09.pdf
Source: http://www.ifg.org/pdf/Searching%20for%20a%20Miracle_web10nov09.pdf
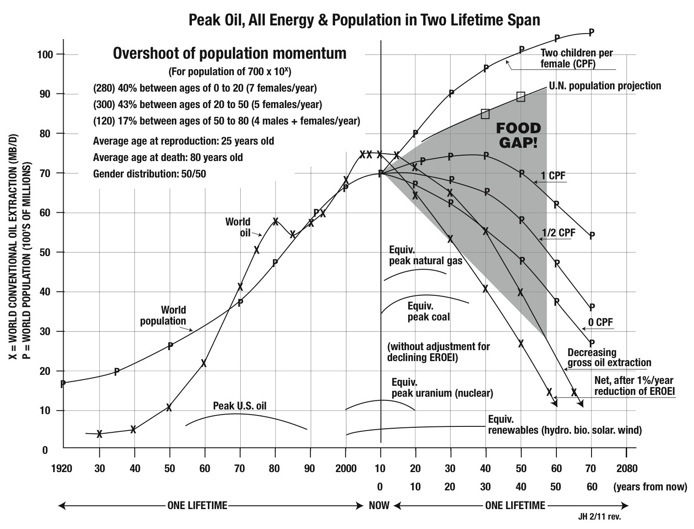
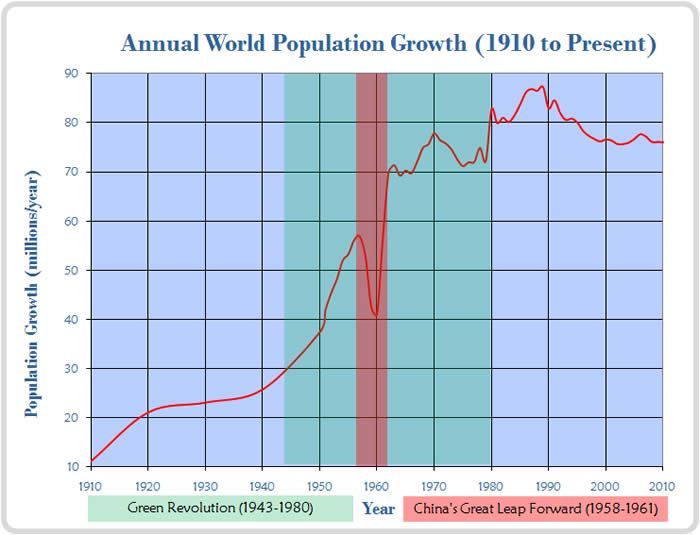
Global population is currently at 7,000,000,000;
increasing at 75,000,000 per year.
Net population growth is ADDING more than 75,000,000 people to the planet (births minus deaths) EVERY YEAR. While the RATE of increase has slowed, we are still increasing the number of people on the planet by 75,000,000 every year. This equates to a current growth rate of just over 1%/year.
At this rate, if we do nothing to change the birth rate, the population of the planet will reach 9,000,000,000 around the 2035 and would reach 13,500,000,000 by 2100.
A person living today who is in their 60s would have been born on a planet with only 1.75 billion people where there are now 7 billion people.
The chart below shows the number of ADDITIONAL people being added to the planet each year 1910-2010
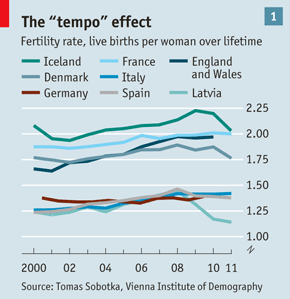
FERTILTY RATES
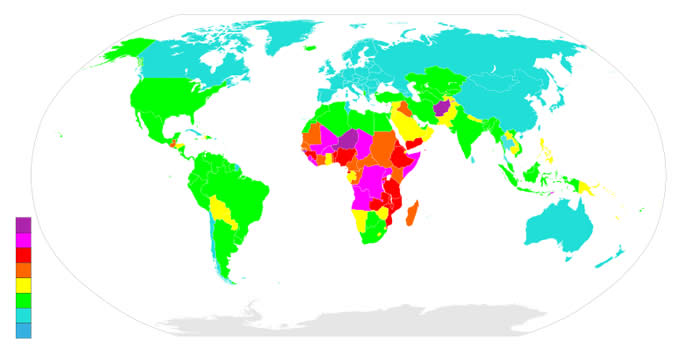
Relative fertility rates
Fertility rates can be affected by many factors. One is economic hardship.
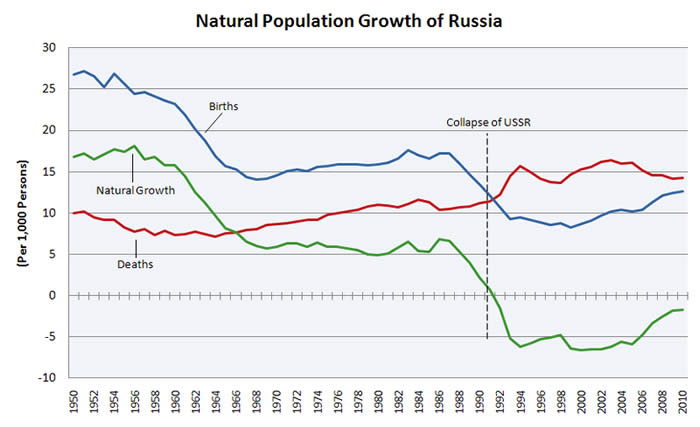
During and following the breakdown of the former Soviet Union, population of Russia decreased due to a decrease in fertility rates. A natural decrease in population took place that resulted from a decrease in available resources.
Effect of of the Global Financial Crisis on European fertility rates:
http://www.economist.com/node/21557774?fsrc=nlw|hig|6-28-2012|2610935|37164905|
A similar drop in fertility rates in Europe occurred following the Global Financial Crisis of 2007/2008
POPULATION, FOOD AND OIL: THE CONNECTION
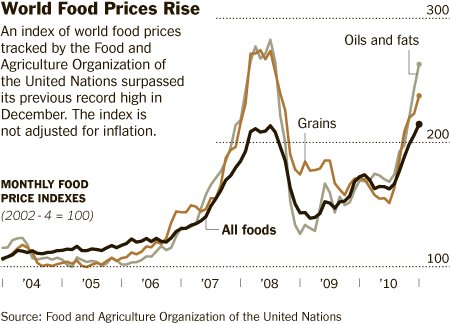
Oil price and food prices track together--closely--VERY closely.
Since the year 2000, when the anticipated future price of oil goes up,
the price of food goes up.
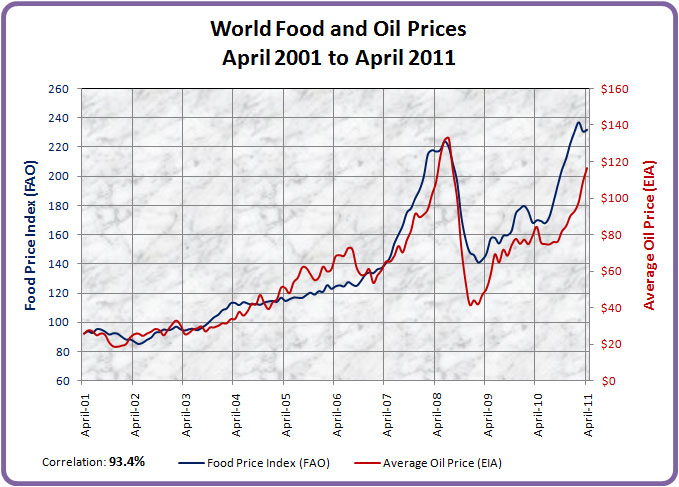
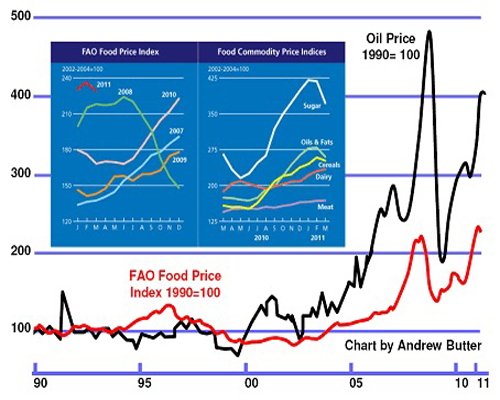
Source: Food and Agriculture Organisation 2012
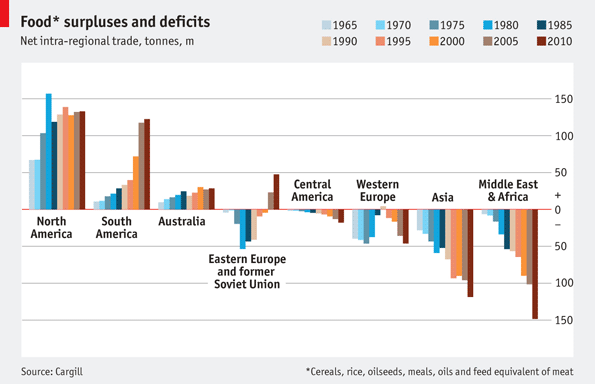
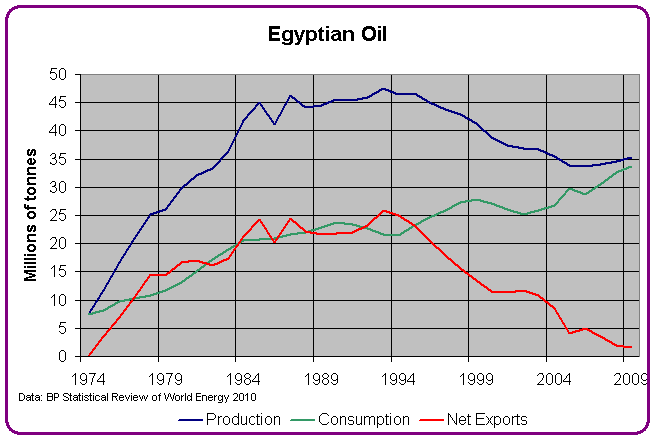
Some regions of the planet produce more food than they consume.
Others, particularly the Middle East, Asia and Africa are increasingly consuming more food than they produce.
Food production surpluses and deficits of world regions 1965- 2010
World fish stocks are declining at an alarming rate
Fish stock conditions
Fish stock declines 1950 -2005
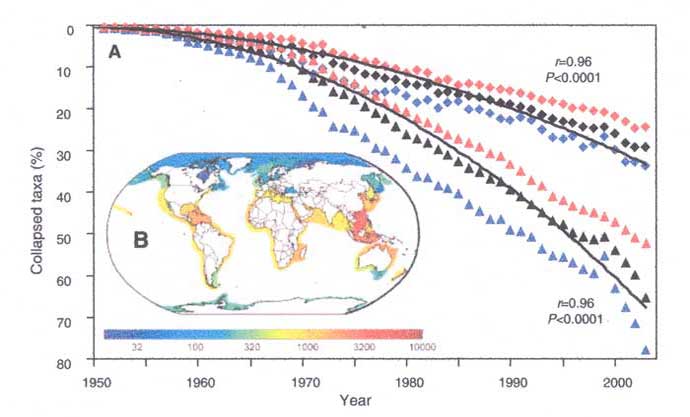
Predatory fish stocks declines from 1960
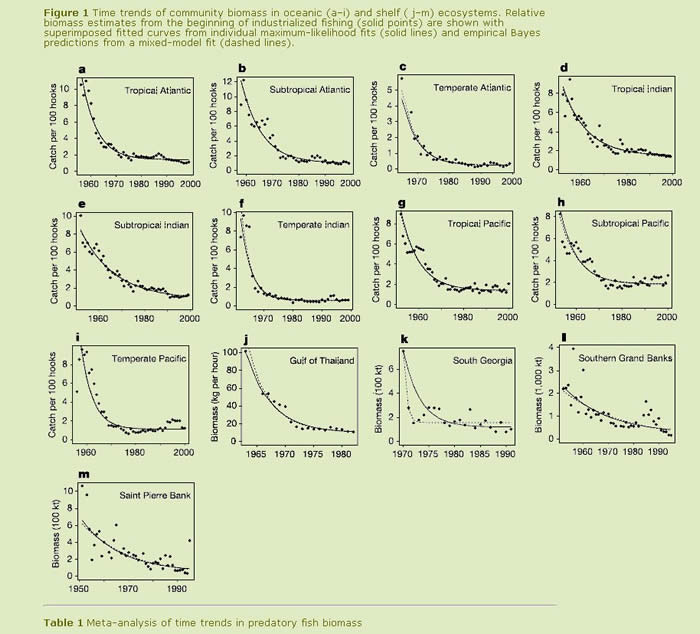
http://www.mindfully.org/Water/2003/Predatory-Fish-Depletion15may03.htm
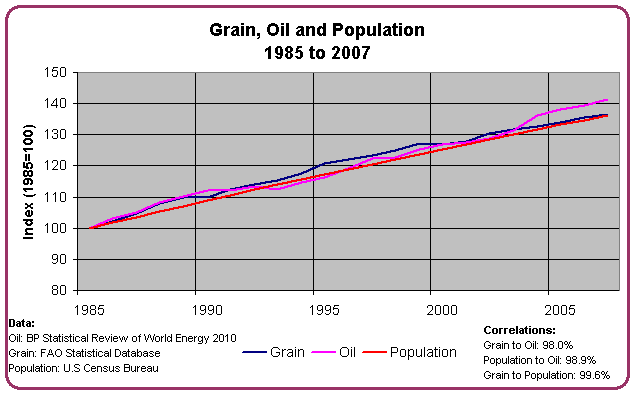
Despite advances in technology over the past 45 years, we have not increased the efficiency of how much oil we must consume to produce a ton of grain.
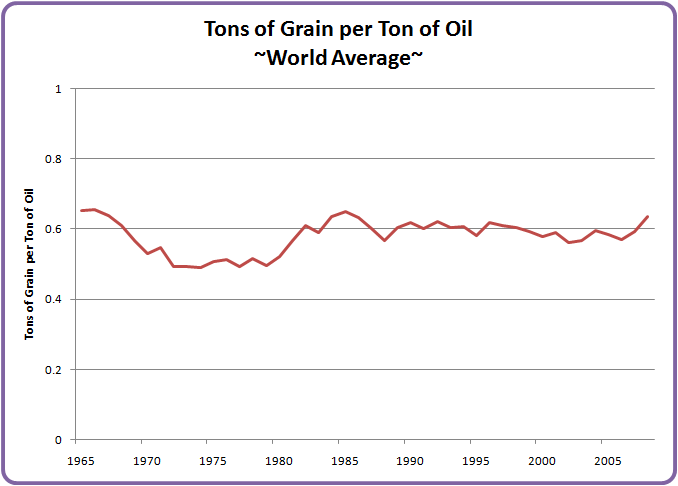
REPEAT: Our ability to support increasing population has largely been a result of our ability to extract more oil that is used to grow more grain.
Meat and cereal prices compared to overall food prices
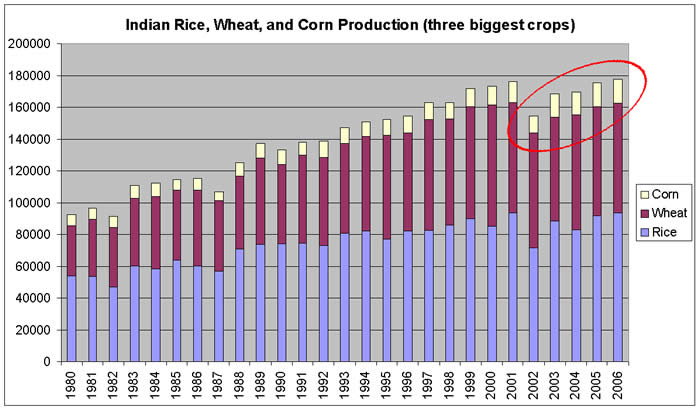
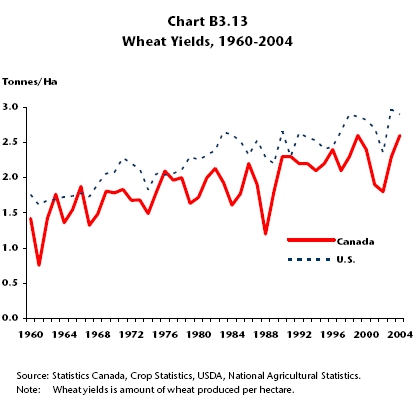
Wheat yields in developing countries appear to
have stopped increasing since since about 1995
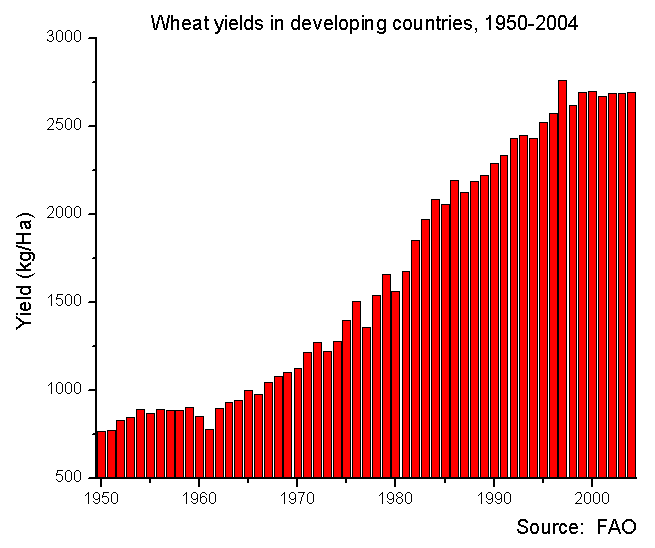
Wheat yields in the USA and Canada have increased
at an average of approximately 2.2% p.a. since 1960
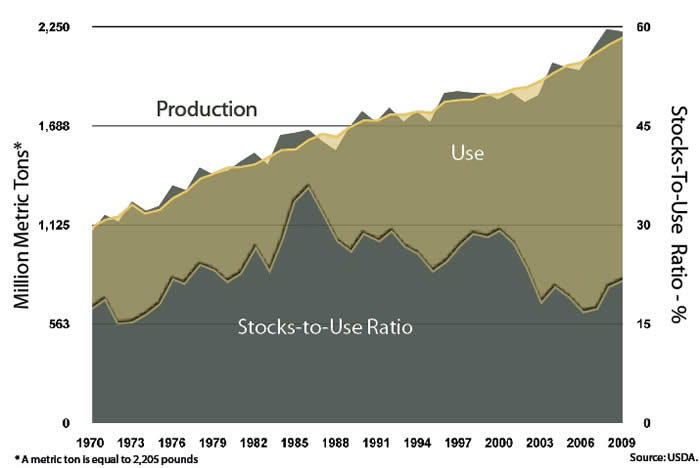
World wheat stocks are declining
(production - consumption)
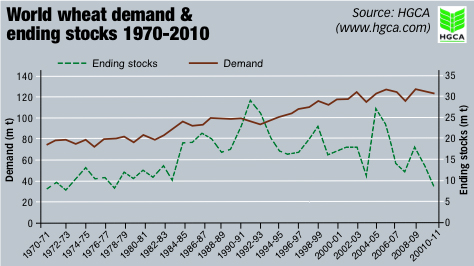
World wheat production, use and stocks-to-use ratio
Individual grain prices 2006 - 2008 on average have doubled
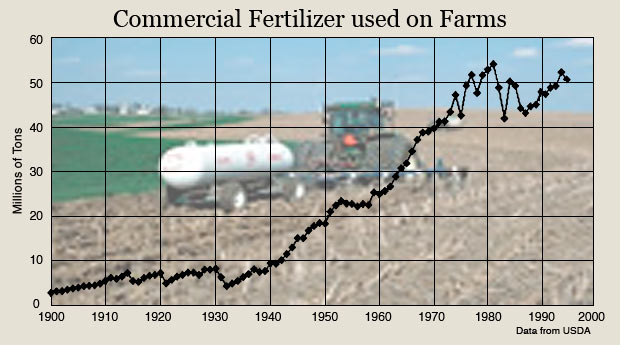
Fertiliser use, worldwide since 1961
Fertiliser use, USA
Fertiliser use 1992-2014, by type
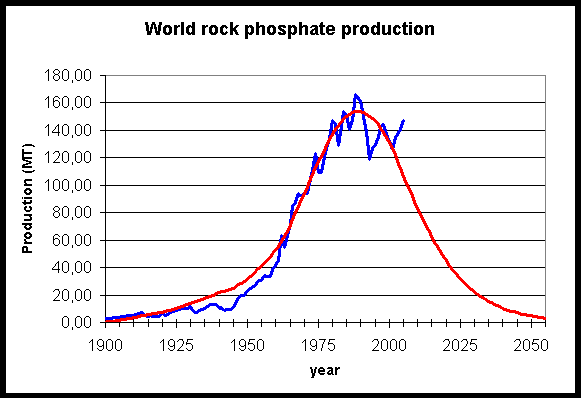
Peak phosphate (fertiliser) production
Fertiliser usage 1952-1993
Fertiliser use vs crop production.
Crop productivity is highly correlated with fertiliser volume.
Soil degradation
Obesity increase explained in one slide:
Increase in income produces a near-geometric
increase in sugar and meat consumption
Incomes in India and China are DOUBLING every four years.
This new-found affluence is driving significant increases in sugar and meat consumption.
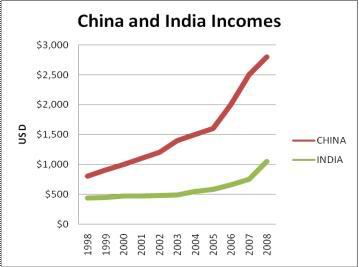
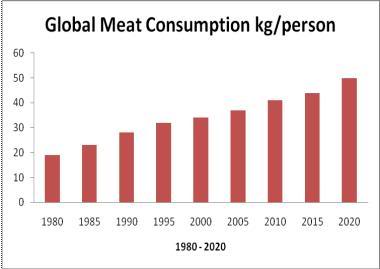
An increase in income leads to an increase in meat consumption
Production of meat requires large volumes of water resources compared to grain and vegetable production
Gallons of water required for pound of product production:
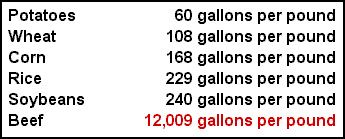
Meat demand increases grain demand
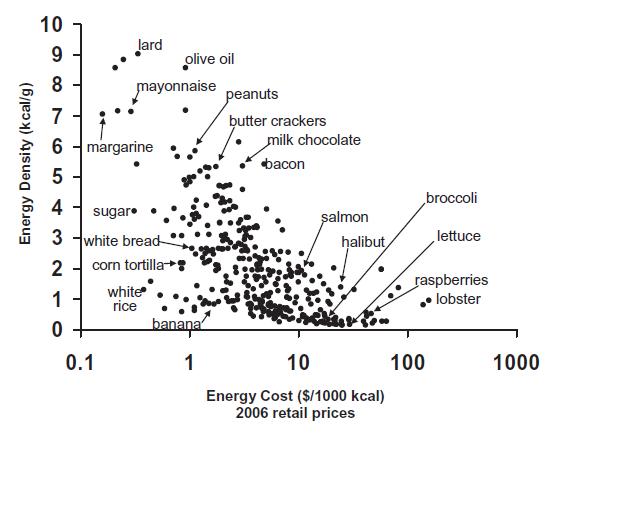
Energy density vs energy cost of various foods
(Upper left best, lower right worst)
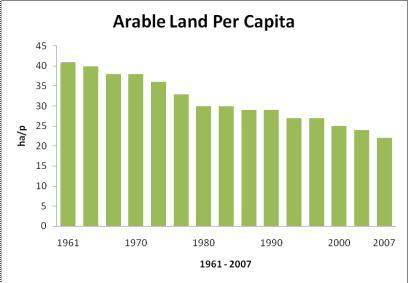
Arable land per capita is decreasing by 50% approximately every 50 years.
Comparison of in-use land to remaining usable arable land in various countries
RESOURCES:
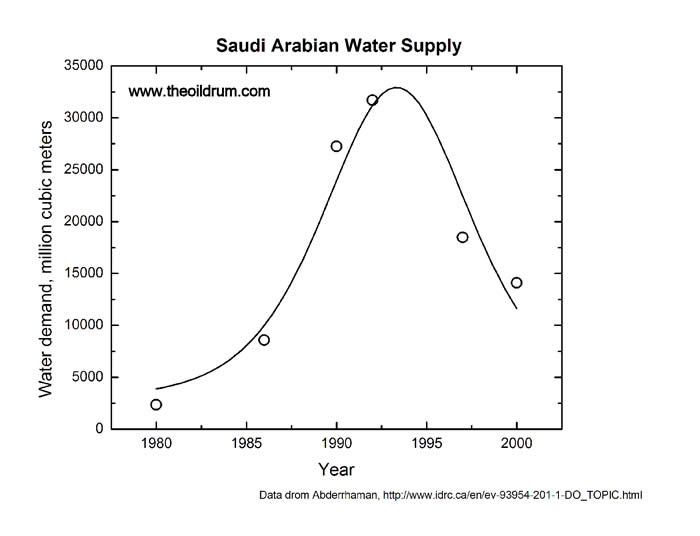
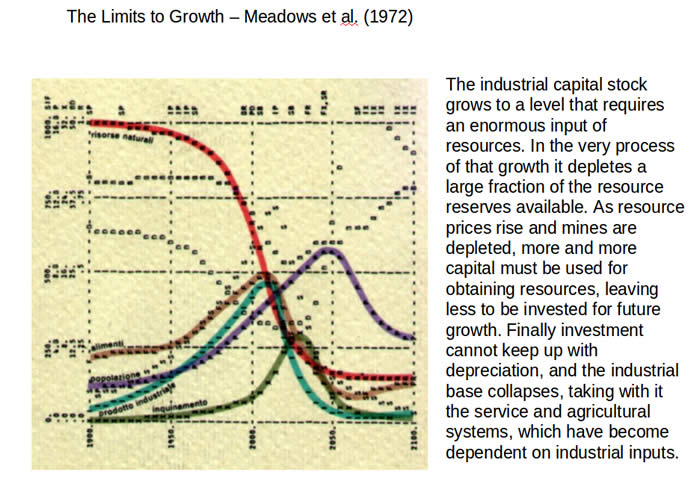
Discovery and depletion curve of natural resources shows a characteristic pattern
Saudi Arabian Water Supplies:
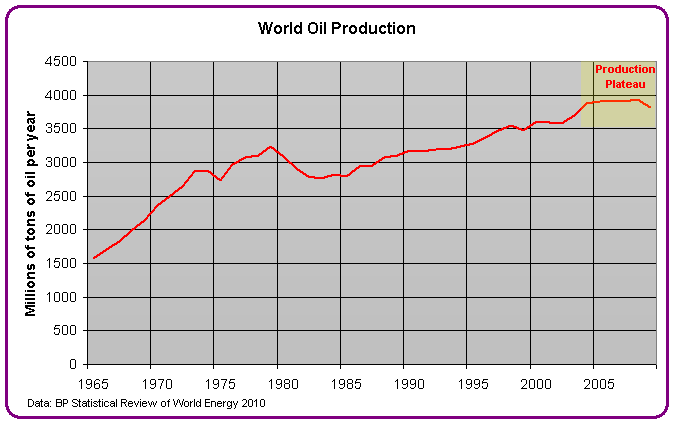
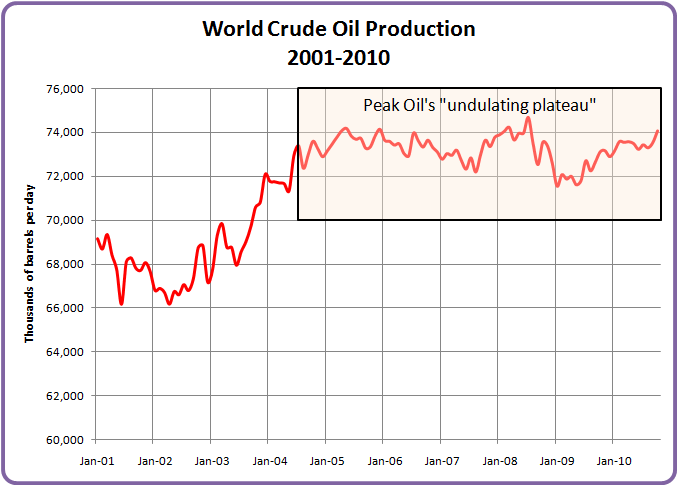
Peak "EVERYTHING"
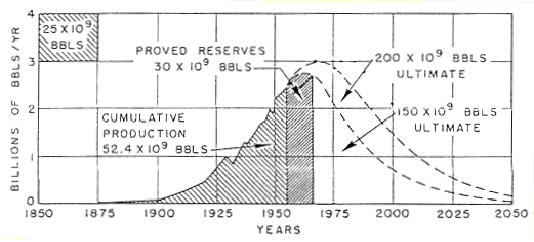
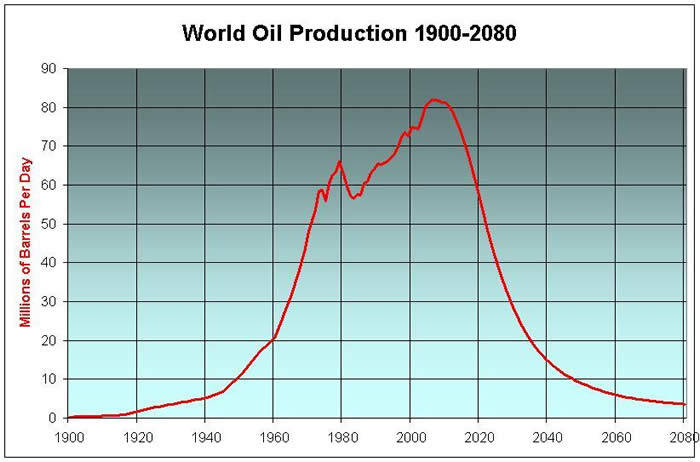
USA Peak-Oil -- The famous King Hubert curve
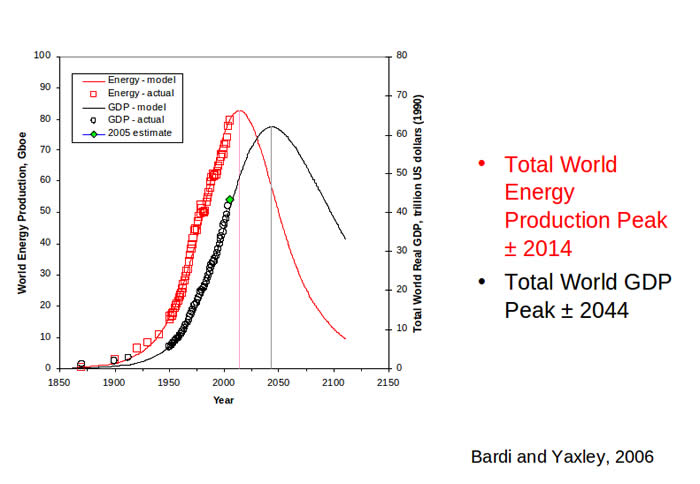
Total world energy production vs Total World GDP
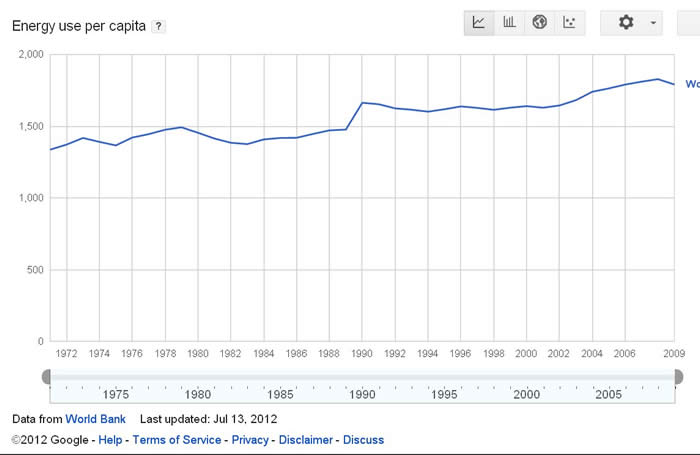
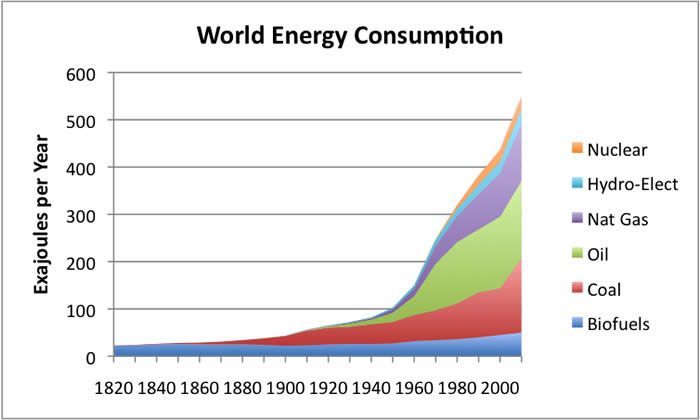
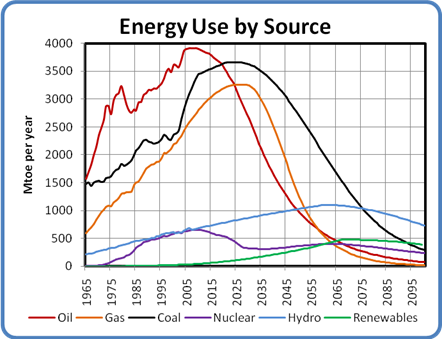
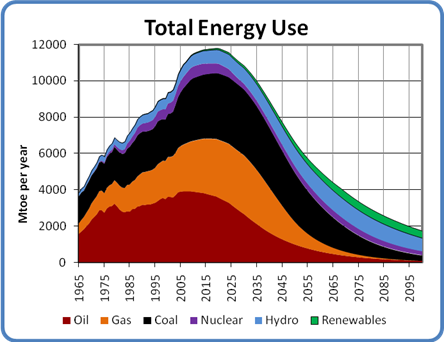
ENERGY
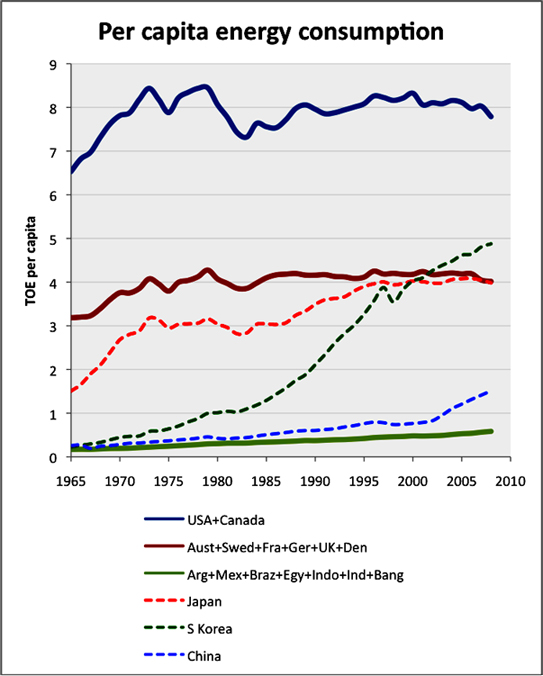
Trend of world energy use per capita 1971-2009
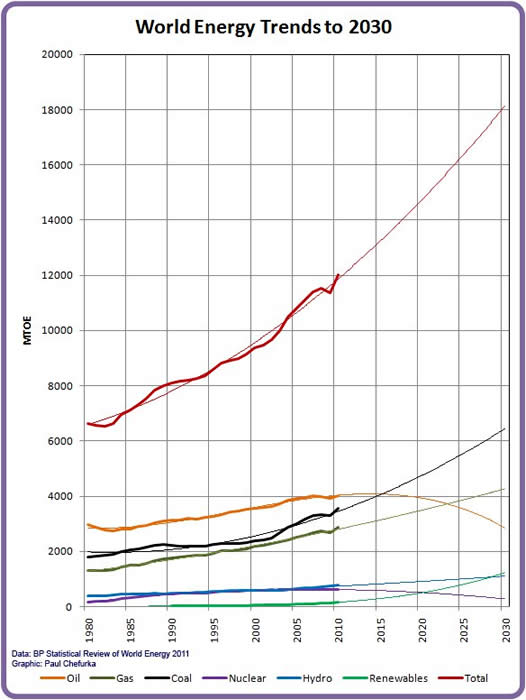
Total world energy demand trend
OIL PRICES, FOOD PRICES AND SOCIAL UNREST
Historically, a substantial percentage of national revolutions have been inspired by hunger. It has occurred in the past (e.g., the French Revolution in 1989) and continues to occur today.
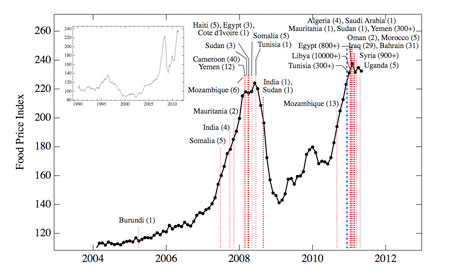
" A provocative new study suggests the timing of the Arab uprisings is linked to global food price spikes, and that prices will soon permanently be above the level which sparks conflicts"1
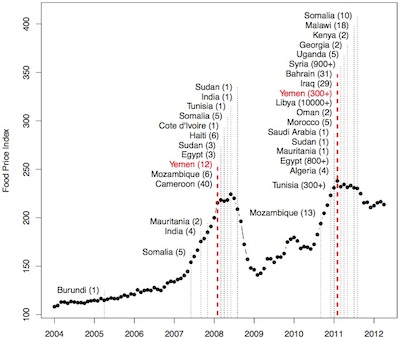
Instances of recent social unrest vs local food prices
1. http://thestandard.org.nz/revolution-and-hunger/
http://arxiv.org/abs/1108.2455
http://www.guardian.co.uk/business/2011/feb/15/world-bank-warns-soaring-food-prices
As the price of oil continues to rise the price of food will follow. When food prices again rise to levels of unaffordabilty for average people, revolution becomes almost inevitable.
The following chart is presented for a second time to emphasise the importance of the connection between oil prices and food prices. The reason for this is simple: Currently, 23% of all crude oil consumption goes toward the production of FOOD.
As the price of oil goes up the price of food goes up.
Given the increasing scarcity of oil, it is unlikely that we will ever see a significant drop in the price of oil again.
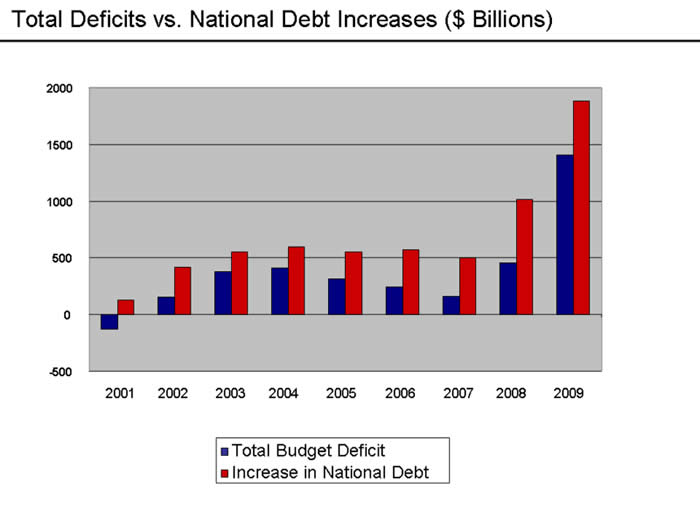
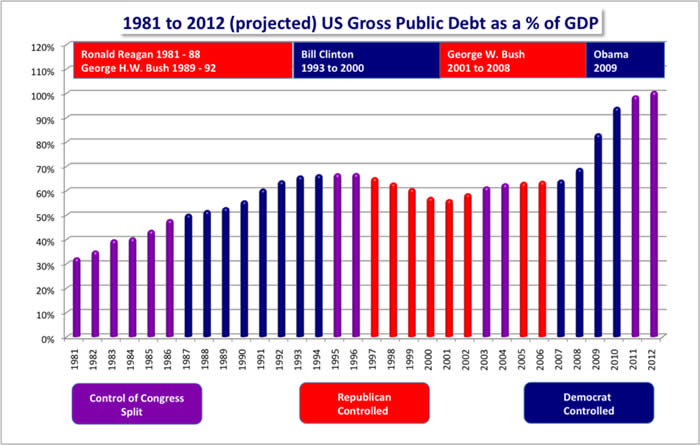
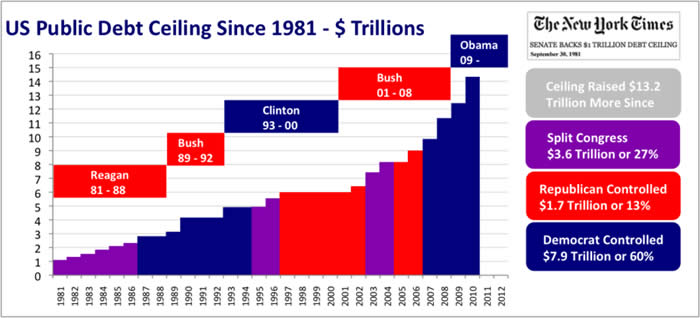
SOVERIGN DEBT
Since the 1980s, we have been borrowing our way out of economic troubles by using debt as a stimulus to temporarily heal a chronically unhealthy economic system. But debt levels have risen to such heights that interest payments on the debt and other committed entitlements will soon outstrip the GDP of many countries, making it impossible to EVER pay off the debt without huge tax increases or governments resorting to pell mell printing of money.
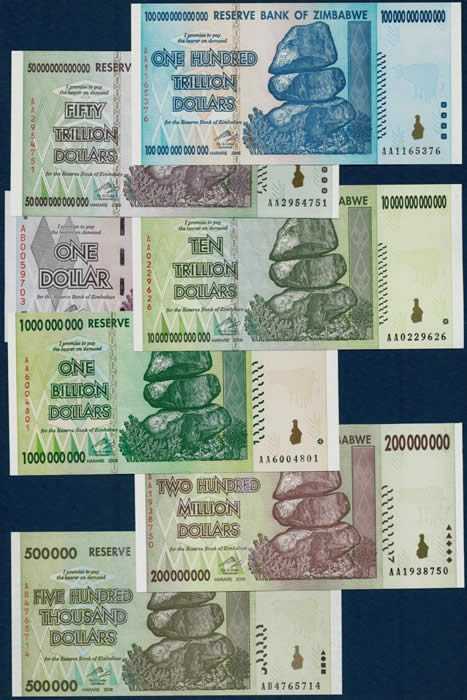
In order to satisfy committed entitlements, some governments resort to printing money, resulting severe hyperinflation. In November 2008, for example, Zimbabwe's inflation had escalated to 79,600,000% PER MONTH, resulting in the abandonment of the currency and a move to US$ as the accepted currency. Zimbabwe currency today is now worthless, literally not worth the paper it is printed on.
The ultimate fate of the US$?
WARNING BELLS?
Sometime between 2030 and 2040 mandatory spending (in the United States) for committed entitlements and interest payments, will exceed government revenues.
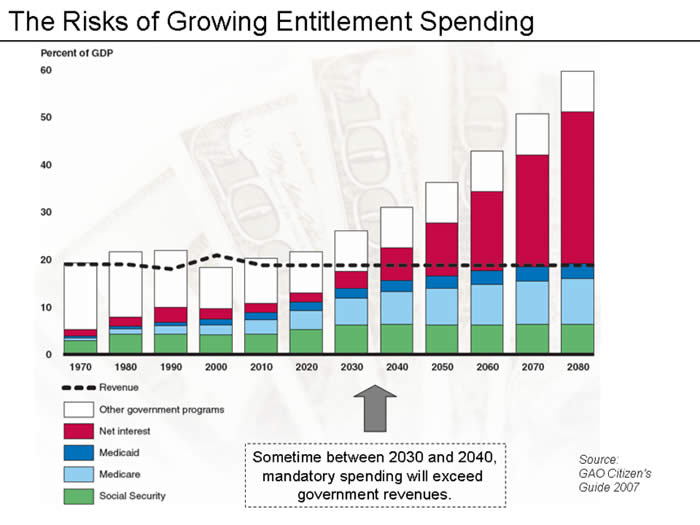
Does anyone appreciate how big a problem this is going to be?
FOUR FUTURE SCENARIOS THE US GOVERNMENT CAN USE TO DEAL WITH THE COMING LACK OF FUNDS TO MEET COMMITTED ENTITLEMENTS:
Potential solution |
Likelihood of adoption |
Probable result |
| 1. Withdraw committed entitlements | Extremely low | Immediate social unrest |
| 2. Pay off debt | Impossible | Collapse of government |
| 3. Raise taxes by more than100%? | Unlikely | Social revolt |
| 4. Print money (also known as "Quantatative Easing") | Extremely high | Hyperinflation and currency devaluation |
The primary attraction of option 4 is that it allows the government to meet its committed entitlements (albeit at great disadvantage to those entitled to those commitments; e.g., social security). The entitled get their due payment, however, the value of that entitlement is significantly reduced as it is now worth substantially less due to the dilution of the money supply.
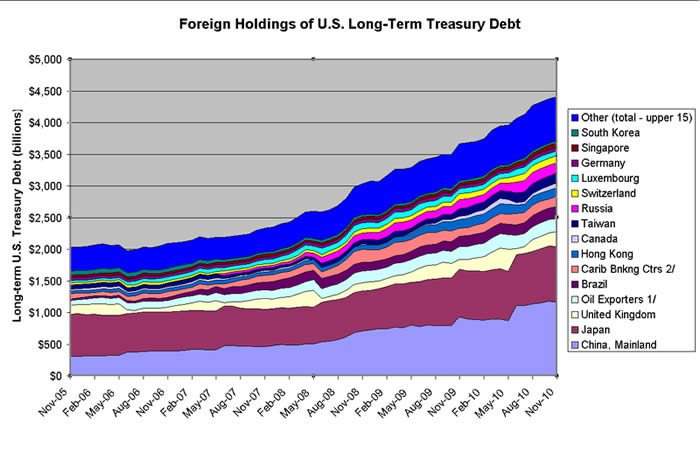
One of the primary reasons that the US Dollar and the US economy have fared reasonably well after the Global Financial Crisis of 2008 is that "historically the US Dollar has been used as means of payment, an intermediary of transactions, and a means of valuation in treasury. Two thirds of international trade is settled by the US dollar. Moreover, wholesales in international financial markets, banks, open markets and operations are mainly conducted in US dollars. The US dollar in assets are also the main foreign exchange reserve for big countries. Finally, international syndicated loan and international bonds trading are nearly wholly traded in US dollars or US bonds. "
http://en.wikipedia.org/wiki/Foreign_exchange_reserves_of_the_People's_Republic_of_China
If faith in the US Dollar were to be undermined by a rapid devaluation brought on by continued "Quantitative Easing" (e.g., money printing), there is a likelihood that the dollar could be replaced by another currency at some stage, with catastrophic consequences to the US economy.
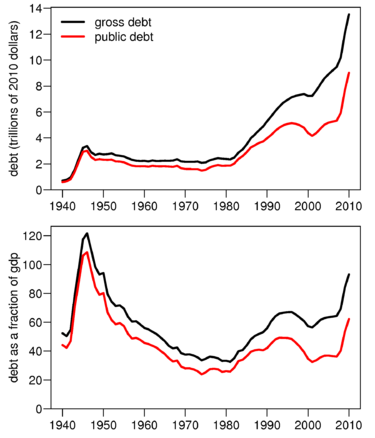
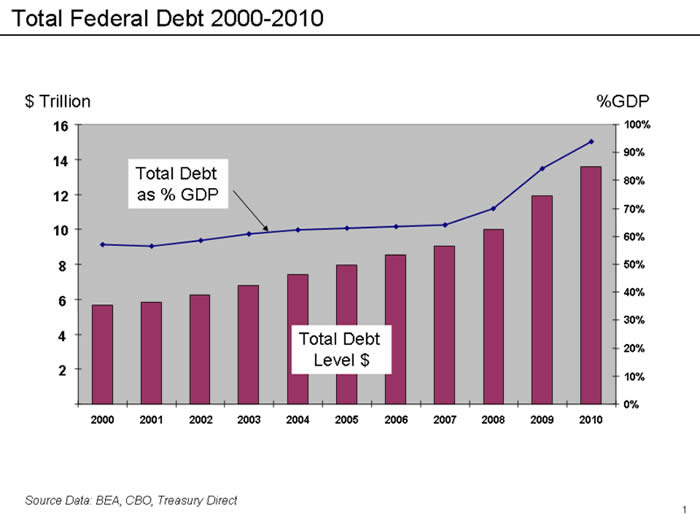
US Government debt is about to exceed 100% of GDP
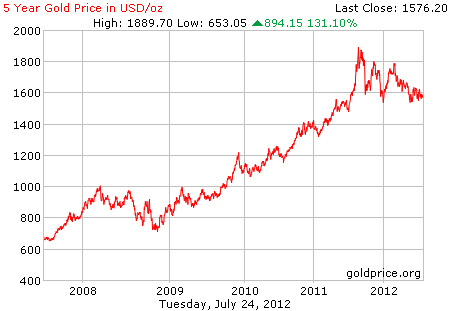
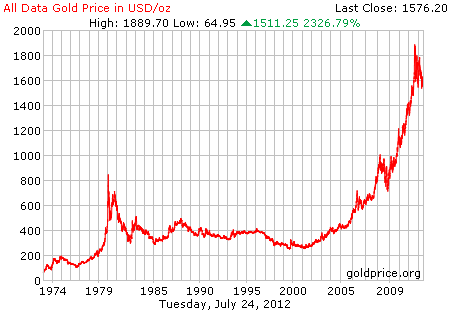
Gold price tends to be inversely proportional to the forward-looking health of the global economy. As economic time begin to look dire, the price of gold goes up.
And up.
And up.
Gold price vs Arca Exchange Oil Index (xoi) 2006-2011
Gold price vs Arca Exchange Oil Index (xoi) 2010
Stock market prices are generally inversely proportional to the price of crude oil. Why? Because the cost of oil is a primary component (and cost) in all manufacturing processes. As oil becomes expensive, manufacturing becomes expensive and companies struggle to turn a profit. Cheap oil means higher profits. Expensive oil means lower profits.
West Texas Crude price vs Dow Jones Industrial Average 1989- 1990
Spot price of Crude Oil vs Dow Jones Industrial Average Jan 1999 - Dec 2000
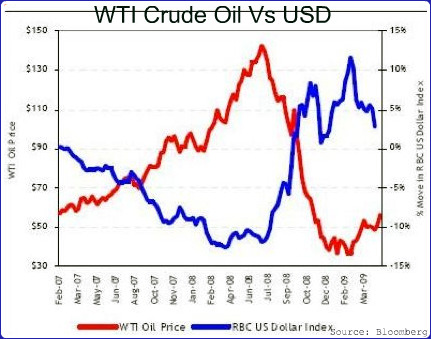
West Texas Crude Oil and the US Dollar are (roughly) inversely related.
When oil is expensive, the Dollar loses value.
When oil is cheap, the dollar gains value.
The bottom line:
PLANETARY ECOLOGY
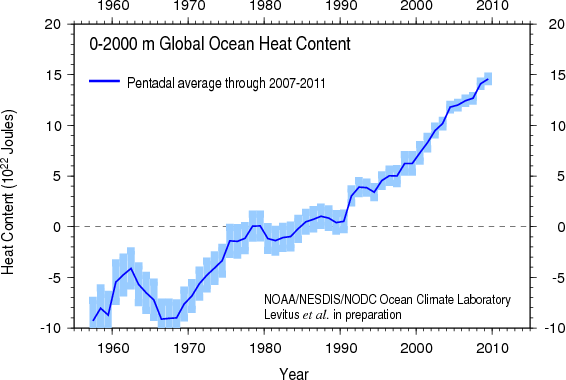
Rising air temperatures. Rising sea temperatures. Another factor enters the global economic equation.
Ocean temperatures since 1880 (source: NASA)
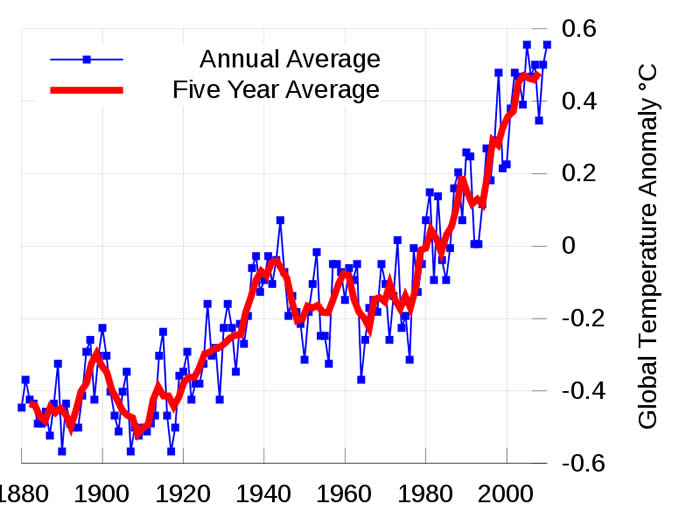
http://en.wikipedia.org/wiki/Instrumental_temperature_record
A must-read for everyone: "Exponential Economist meets Finite Physicist"
LINKS
Sustainable Population Australia
https://www.population.org.au/
Dick Smith Population
http://dicksmithpopulation.com/
The End of Growth
http://richardheinberg.com/bookshelf/the-end-of-growth-book
Jeremy Grantham in Nature--November 2012
http://www.nature.com/news/be-persuasive-be-brave-be-arrested-if-necessary-1.11796